Earthquakes in the World.
A Python script to plot earthquakes that have occurred in the world, using the Matplotlib Basemap module.
Fall 2011:
CSCI 444 - Data Visualization - Dr. Jesse Johnson

What was the project assignment?
The project assignment was to use a chosen dataset to create a visually stimulating infographic. I chose earthquake data
because I have an interest in Self-Organized Criticalityand
how earthquakes are part of Earth's criticality events (aka catastrophes). Catastrophes have a stigma about them; we always think of them
as a terrible event that costs many lives. This is true in the case of earthquakes and the resulting tsunamis. However, catastrophic events
also create stars and planets and push land out of the sea, which eventually results in life being sustainable above water and the evolution
of mankind. This ultimately brings us to the point where we have the ability to ask these questions of "How Nature Works" and "Where We All Came From".
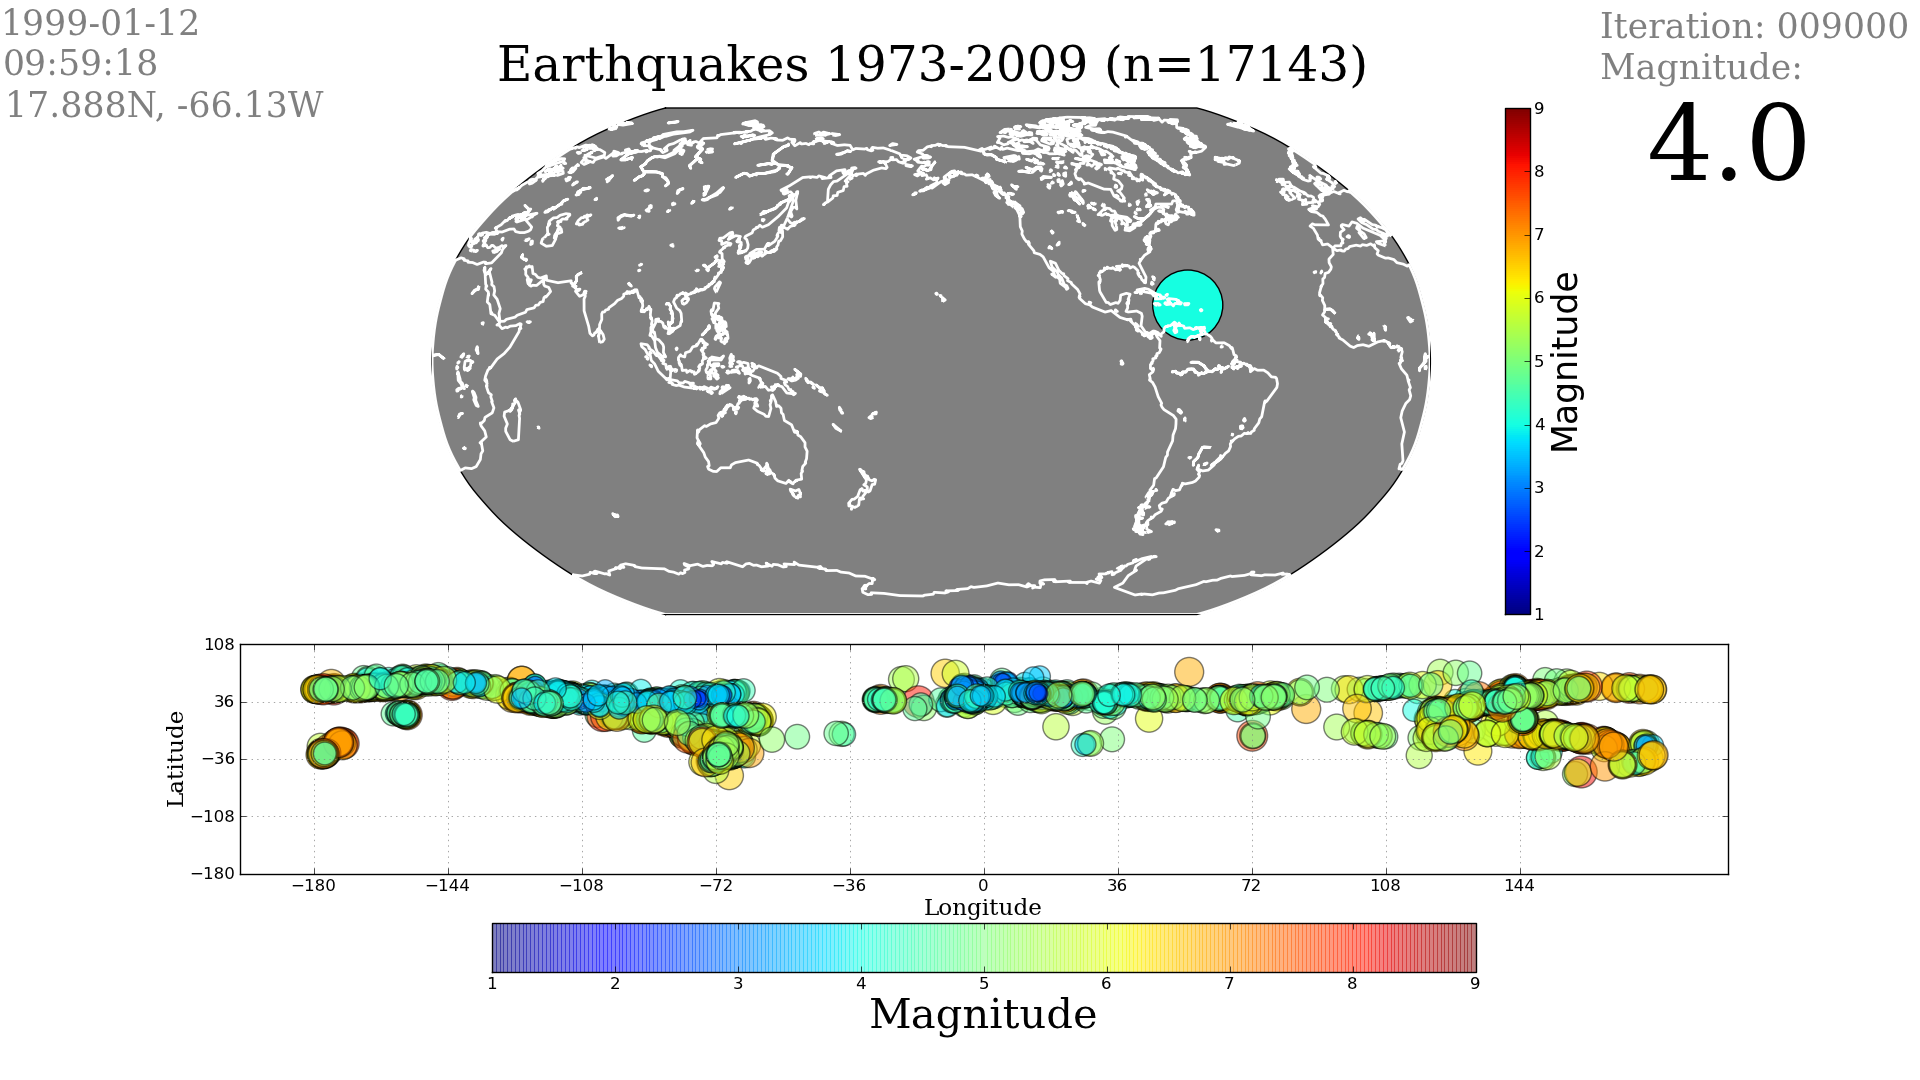
I accomplished my goal of visualizing this data by creating a single plot for each earthquake event, using the Matplotlib library,
Basemap. Essentially, each data point was a data, time, longitude, latitude, magnitude, and (sometimes) death and injury
counts. I didn't include the death or injury counts because I couldn't find data for each event and I wanted to maintain consistent information between each earthquake.
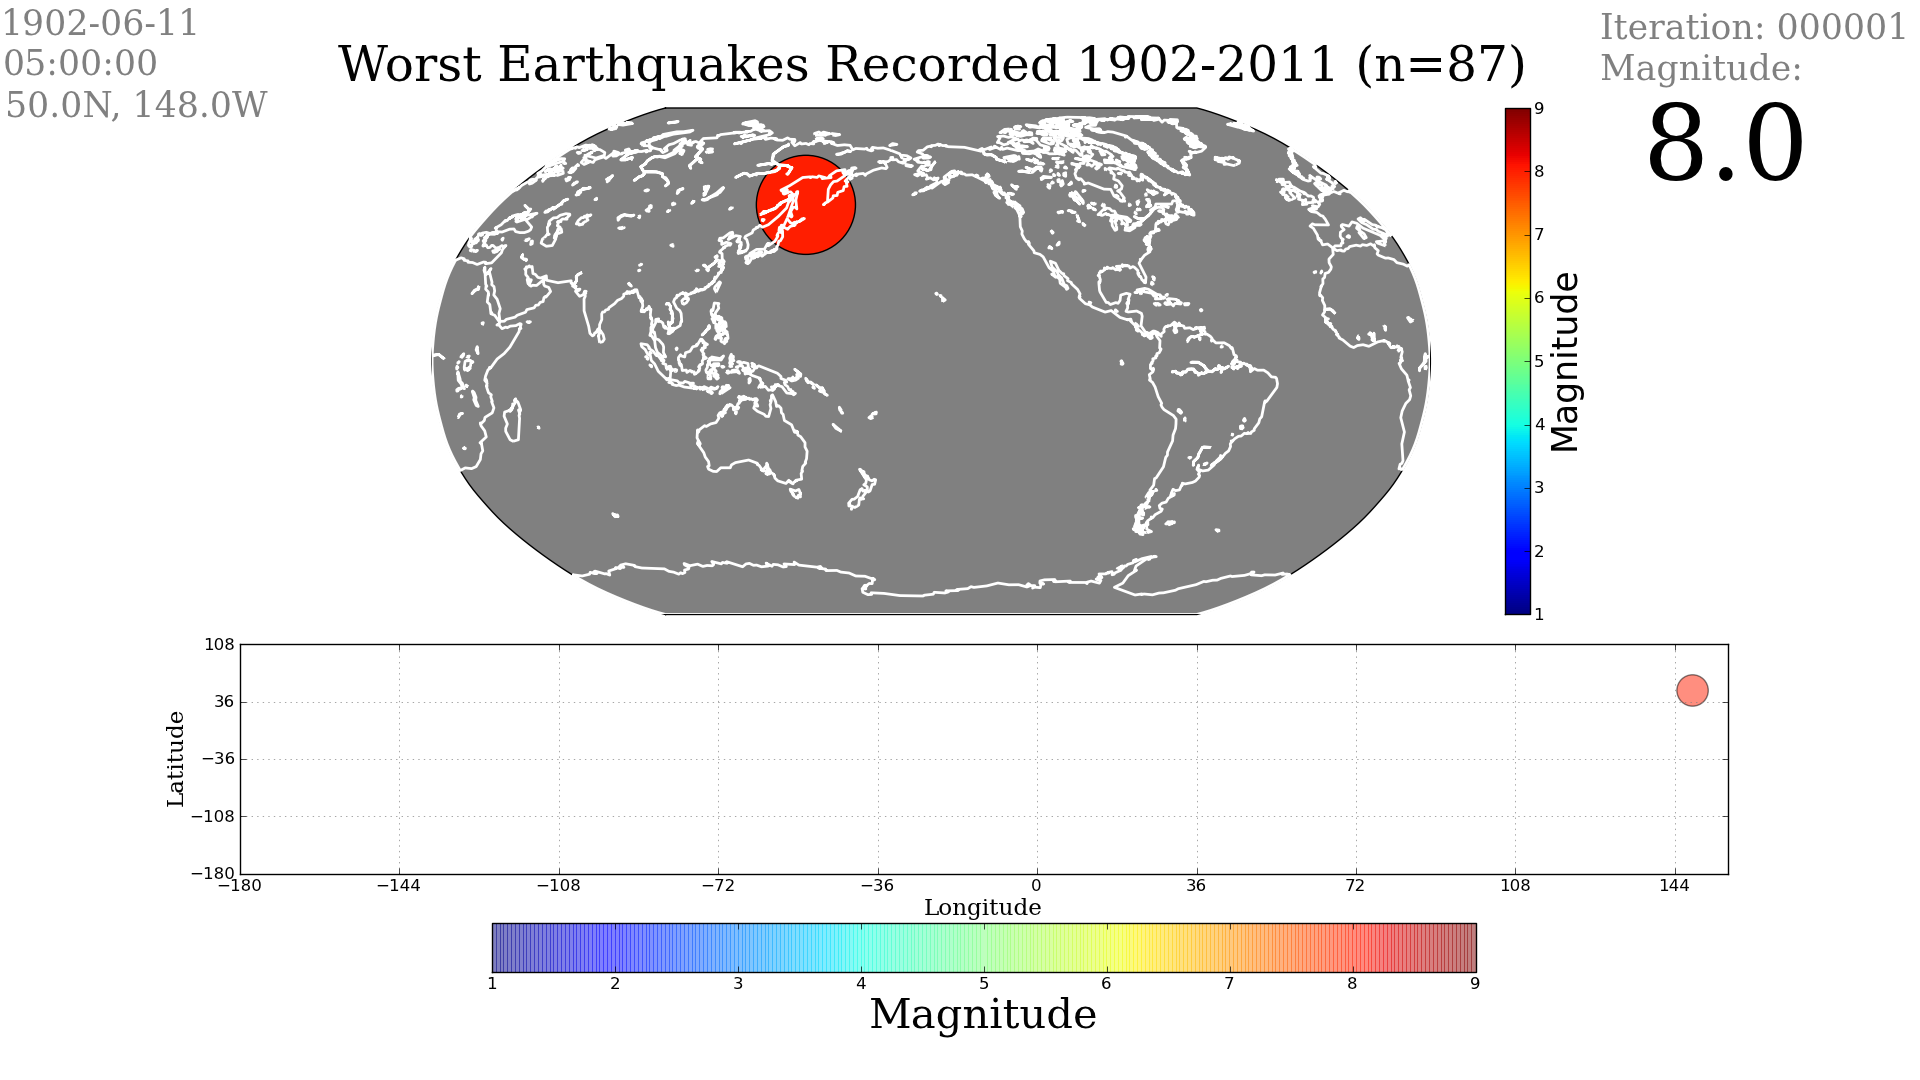
I used two different datasets: one with all earthquake events between 1973 and 2009 (n=17,143) and the other with the worst recorded earthquakes in history between 1902
and 2011 (n=87). I had two other datasets: significant earthquakes and significant US earthquakes, however both were missing magnitude information so I discarded them.
What did you learn from the project?
Before taking this class, I had no idea how easy it was to deceive with graphs. I can now spot examples of poor or misleading graphs throughout our newspapers
and even science magazines. This project showed me how easy it is to create an honest graph using very little resources to display a great deal of information
by allowing a user to quickly see all parts of the data at once. There is never a reason to add too much information or misleading information to a graph; it
is always much cleaner and more readable to simply add the necessary information. These visualizations do exactly that by using the rules and regulations set out by
Dr. Johnson in Data Visualization and Edward Tufte in Beautiful Evidence.
What are you most proud of?
I was really proud of being able to incorporate so much of the individual elements from the dataset into one simple infographic that is visually stimulating. I was impressed
by how robust Matplotlib is in terms of being able to create such a beautiful graphic with so many choices for fonts, alpha channels, subplots, and high definition image output.
From reading in the dataset .csv file to the final deliverable, Matplotlib was a great success the entire way. I would highly recommend this product to any scientific or hobby
Python enthusiast.
What was your role in completing the project?
The first step was to plot the earthquake events. I started by plotting the most significant earthquakes on the basemap atlas. Once I got those plotted, I moved to creating
a colormap with specific colors and alpha channels. I then moved to plotting all of the events. My end goal for this project was to include audio that represented each event
in magnitude (a high pitched sound for a small earthquake and a deep low pitched sound for a large earthquake). I started delving into audio libraries in Python, but it became
complicated quickly and I decided to finish my high priority requirements before moving forward with audio. Instead, I worked on formatting annotation and parameters. I formatted
.png file names and date to maintain preceding zeros, and worked with text placement. I formatted coordinates and datetime to be less obstructive and the magnitude to be more
noticeable in the visual. I adjusted the font-family of the visual text information to a "serif" font to be more readable and pleasing to the eye. Finally, I used subplots to
create more information for each earthquake. I used subplot2grid to create a table for my subplots and an alpha channel on the scatter plot to be able to see each event on the
subplot as well as on the basemap.
Initially, I created a group of images as a first draft to test Basemap. My final deliverable was a presentation demonstrating my final draft plot images and an animation, as well as a short write-up .
.
First Draft: All Earthquakes


Final Draft: All Earthquakes

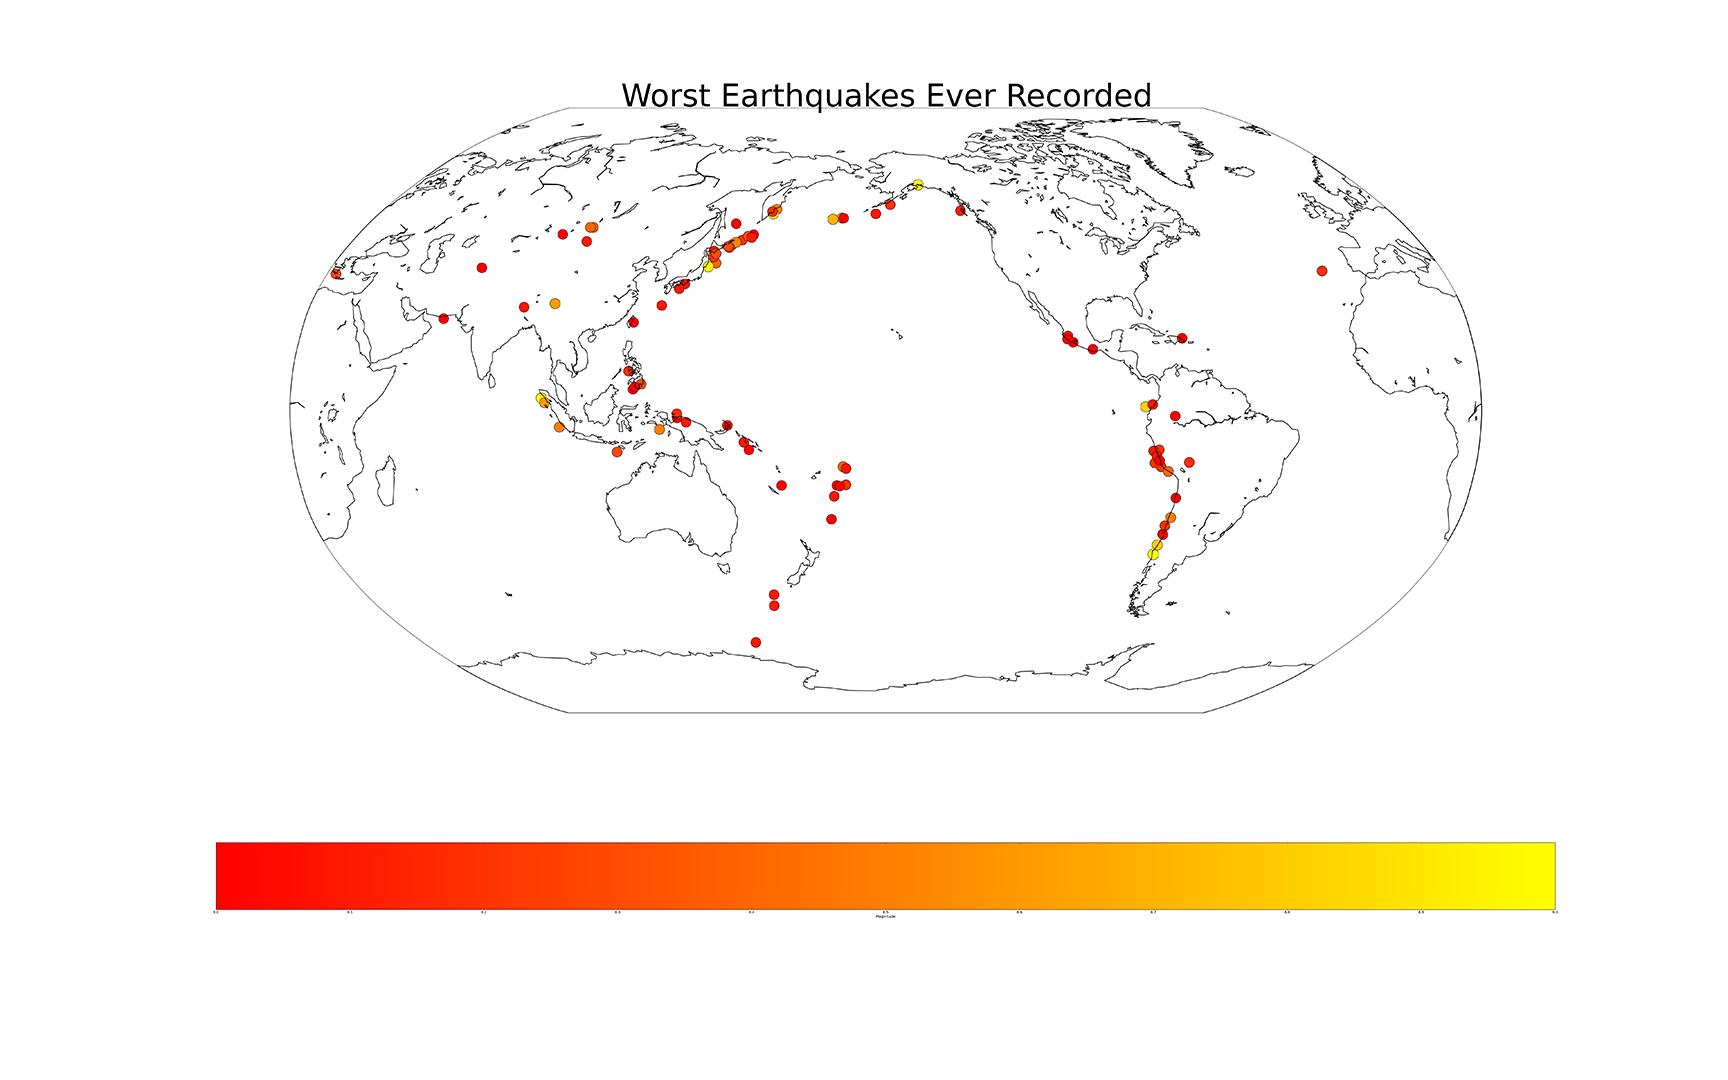
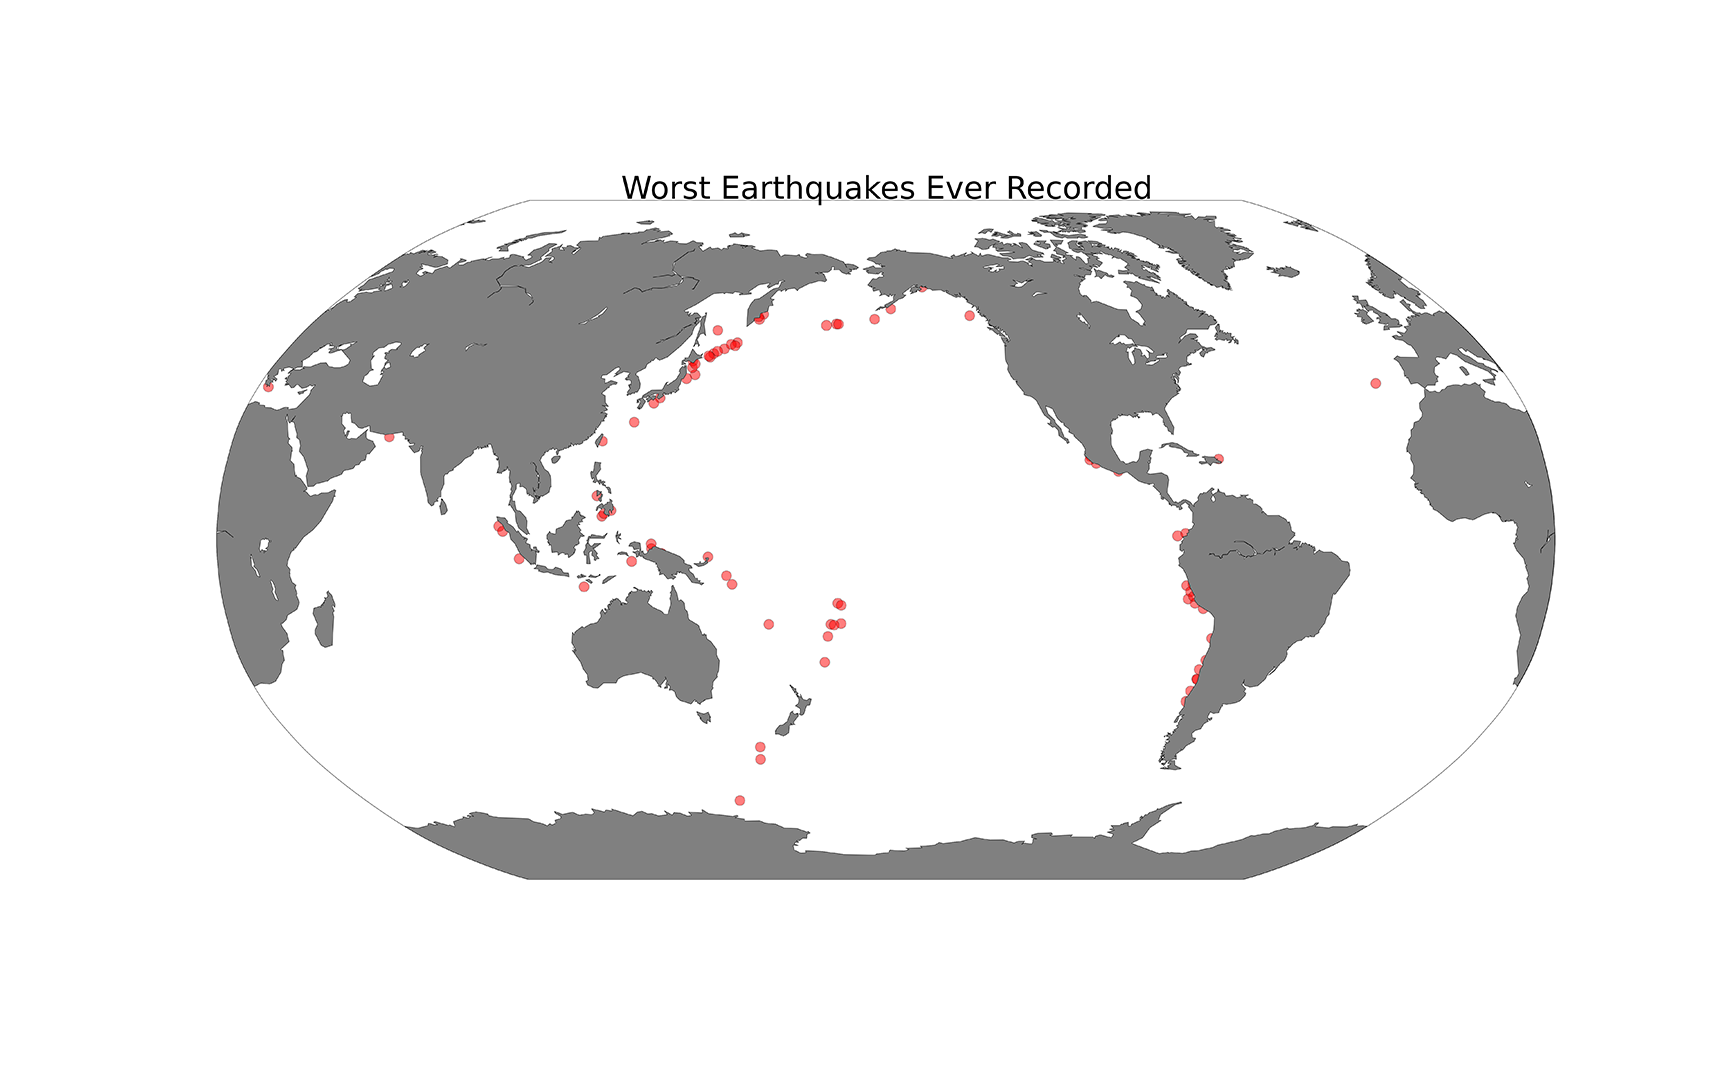
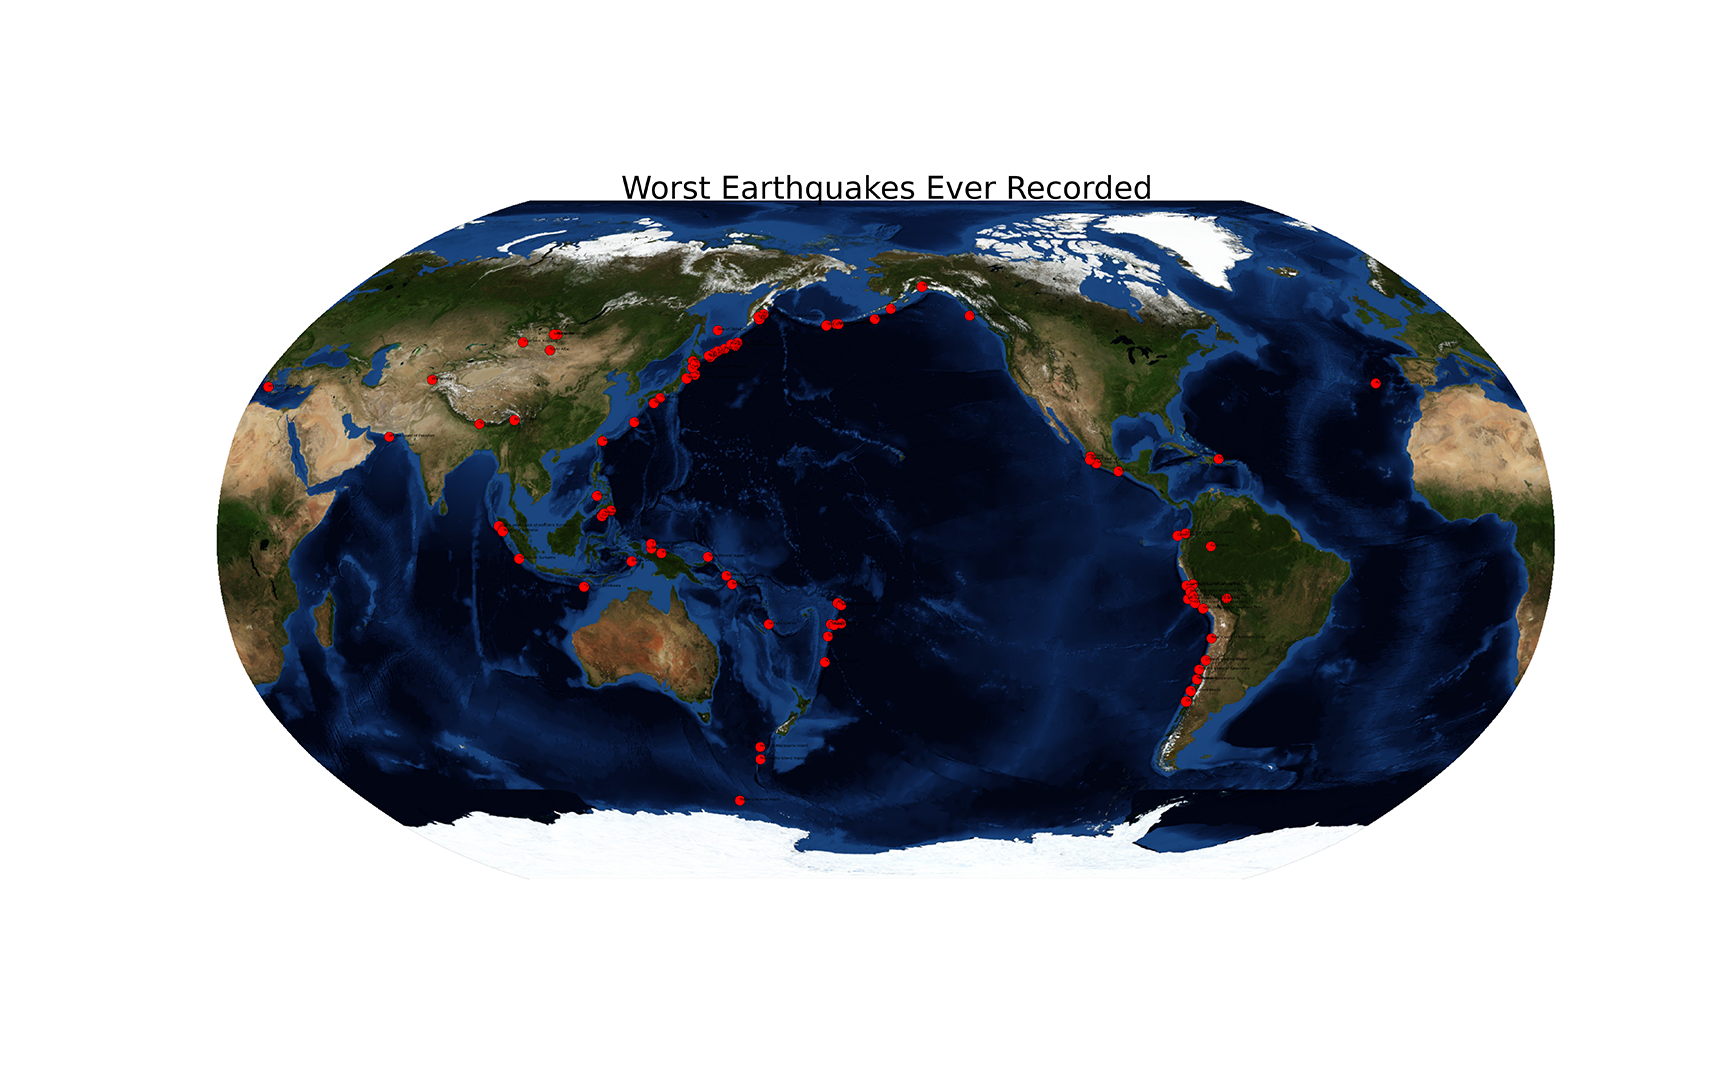
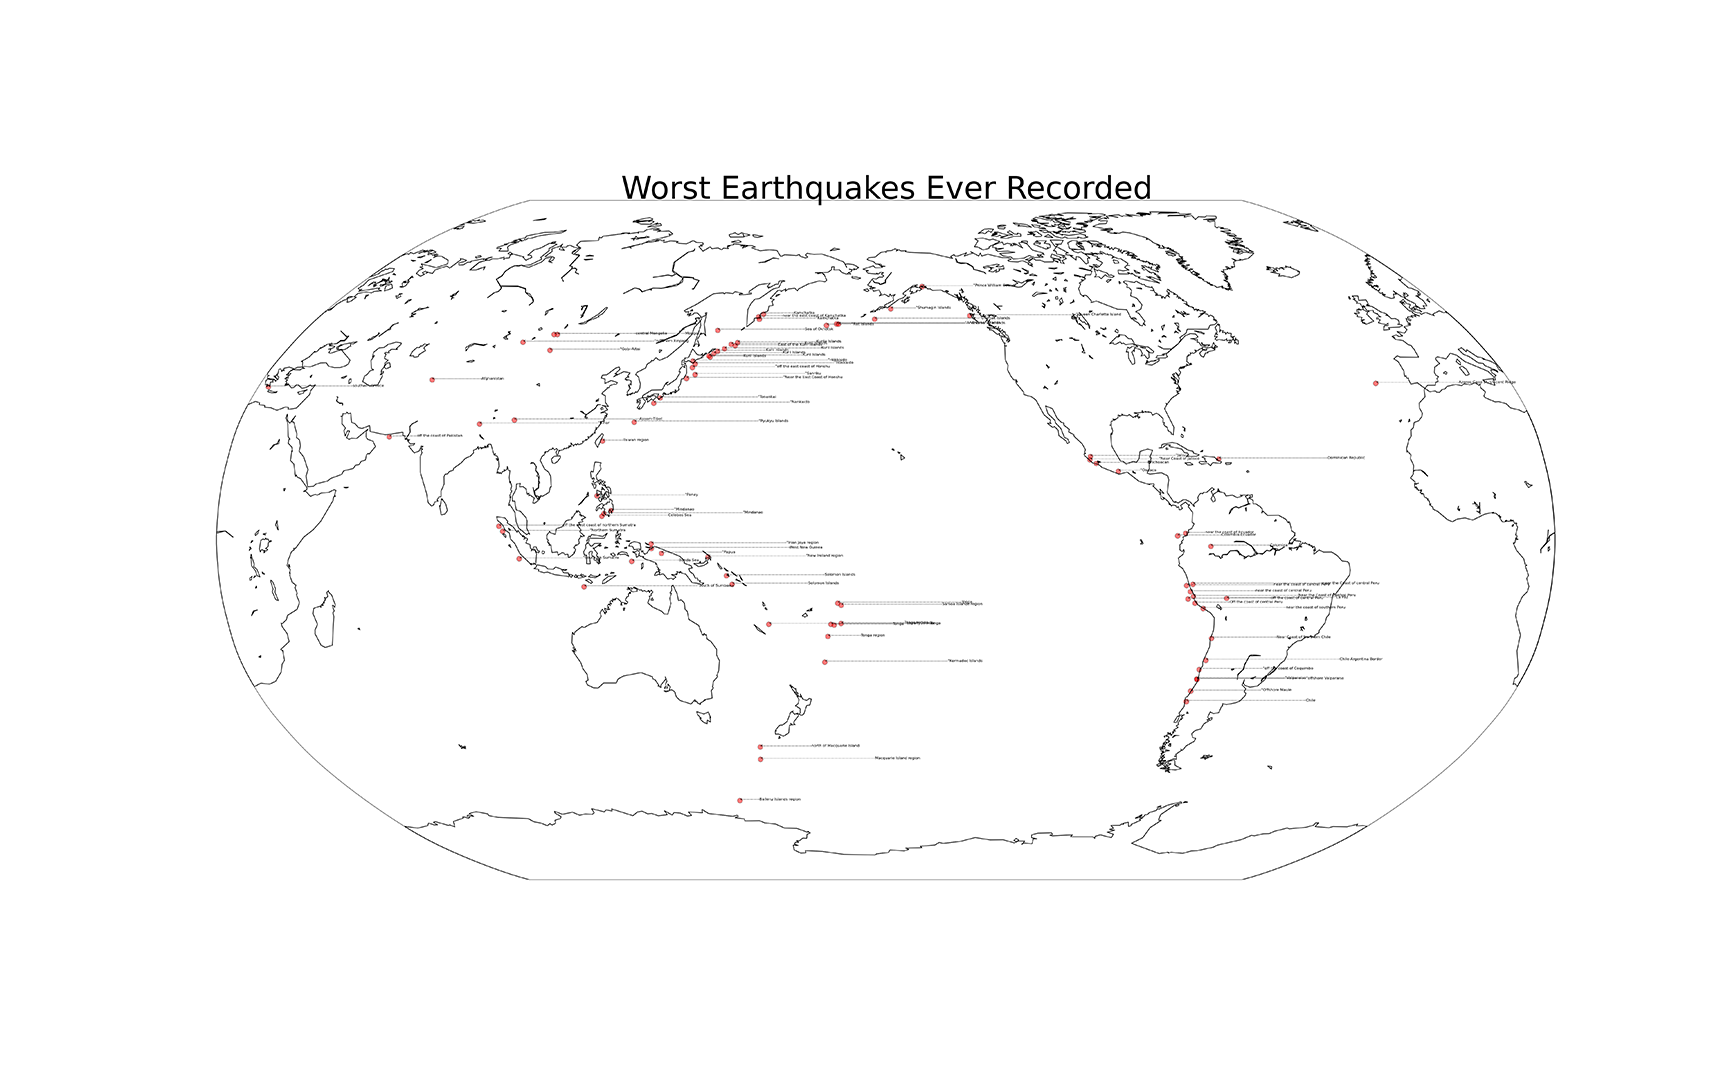
Final Draft: Worst Earthquakes
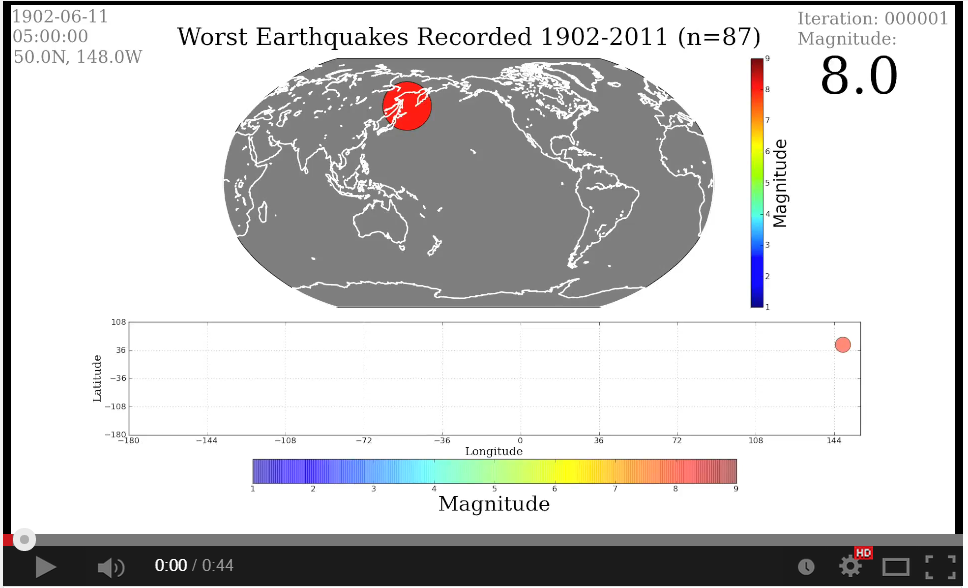
Final Draft: Animation of Worst Earthquakes
What would you do differently next time?
As I mentioned before, I would like to add audio to this project, but overall I was pretty pleased with my output. I thought the infograph was visually pleasing and easily readable
to the average viewer. If anything, I might add a second plot of the basemap to keep a bread crumb of each event so the user can see all the earthquakes that have happened so far
all at once. It might also be nice to create an interactive globe basemap so the user can see the earthquake events from any chosen angle. One final adjustment I would like to make is
to show the viewer what area each longitude/latitude point represents in the lower subplot so they can easily visualize the areas being affected by the earthquake events.
This project is also found on GitHub